Azure Cost Management
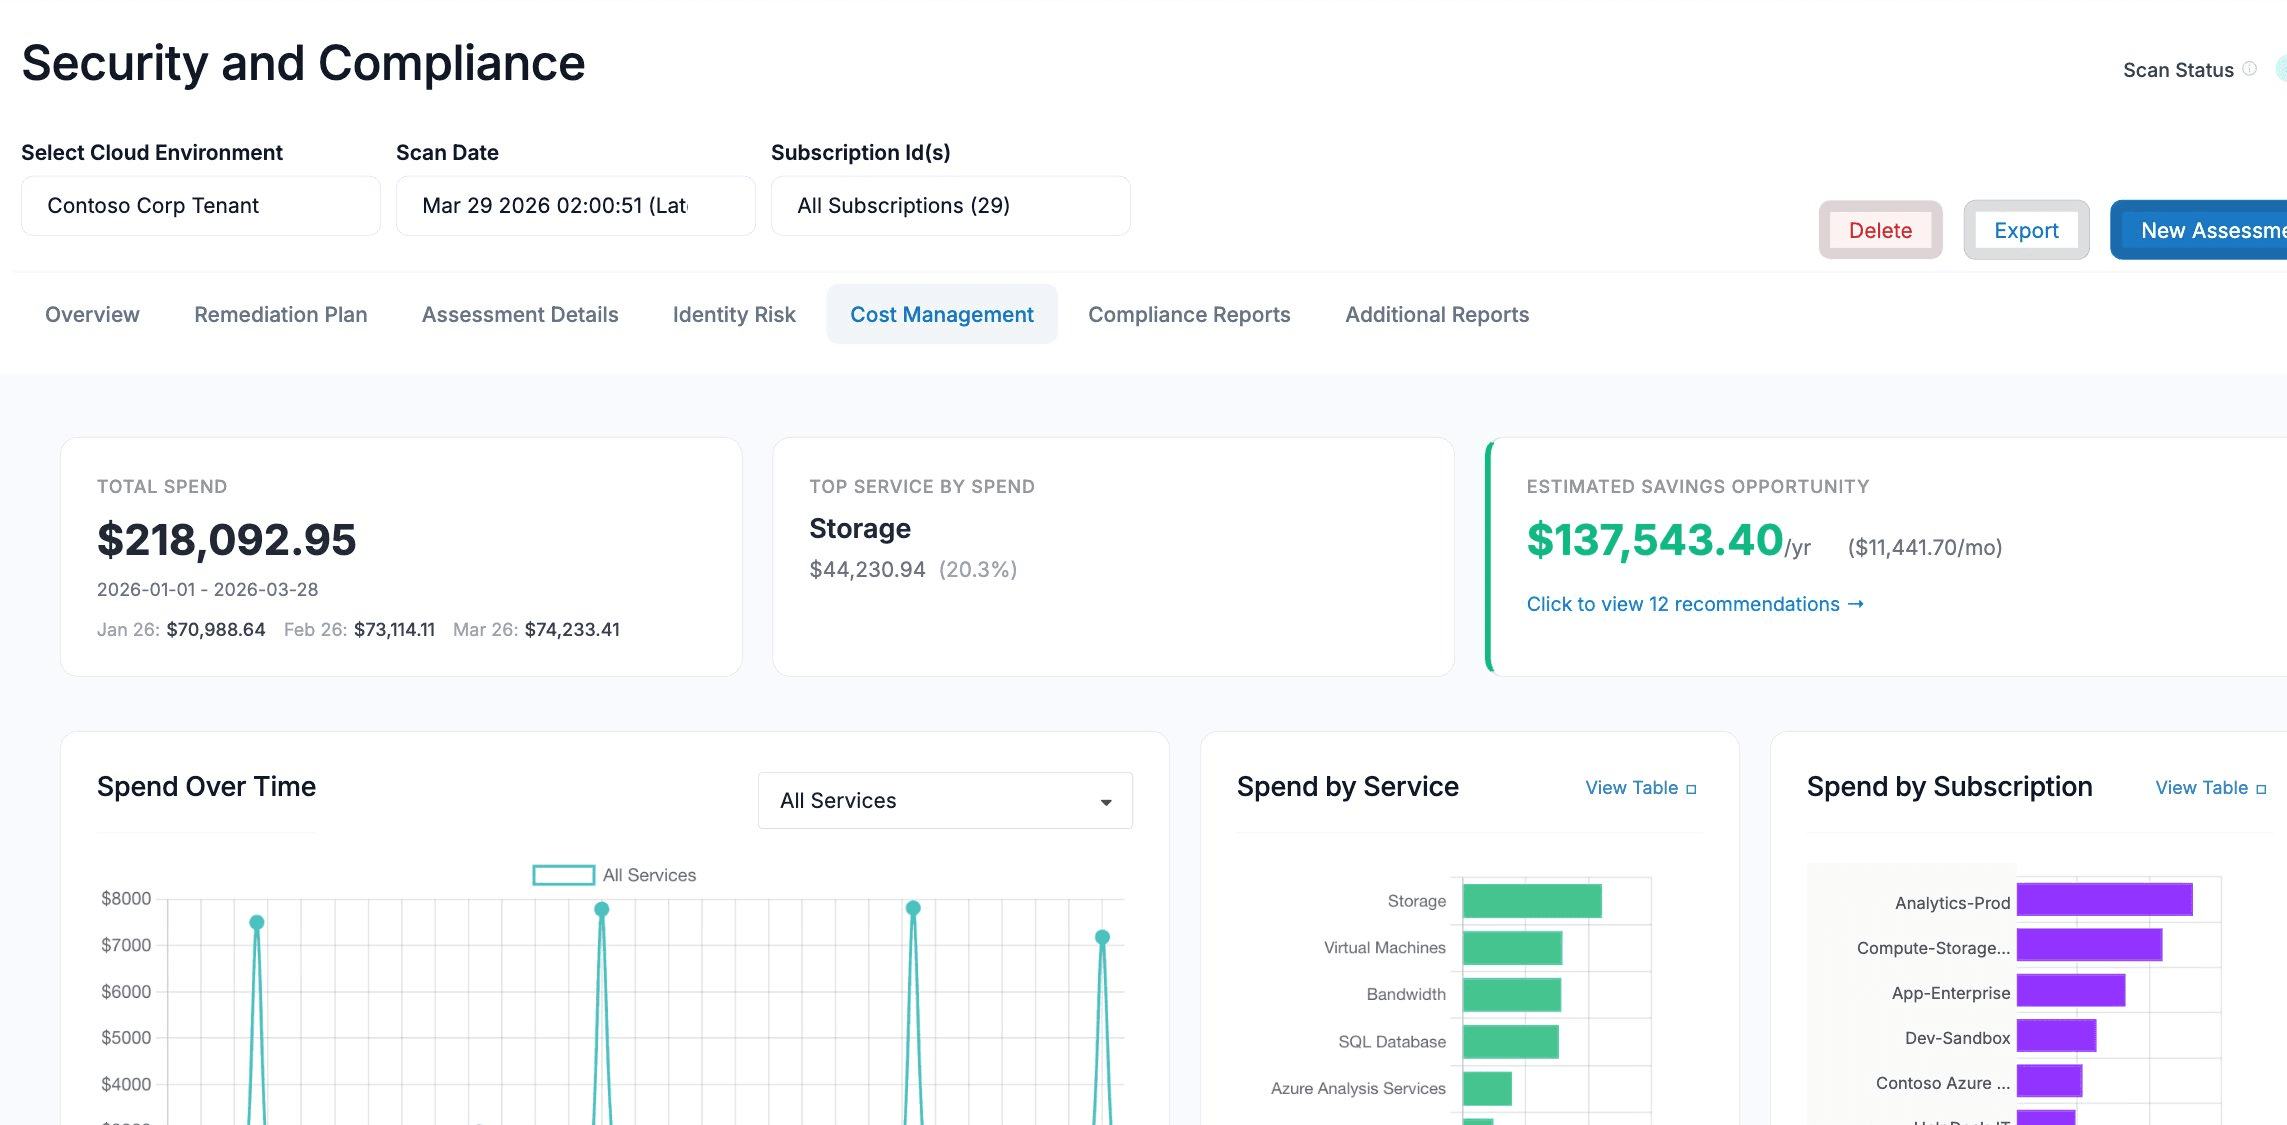
The Cost Management tab for Azure provides visibility into your Azure spending and identifies opportunities to reduce costs. It combines billing data from Azure Cost Management with optimization recommendations from Azure Advisor and the ASecureCloud assessment engine.
To access Cost Management, navigate to Security and Compliance, select an Azure cloud environment and scan date, then click the Cost Management tab.
Summary Cards
Three summary cards appear at the top of the page.
Total Spend
Displays the total spend across all Azure services for the assessed billing period. Below the total, the three most recent months are shown in chronological order (oldest to newest), with the current month highlighted.
Top Service by Spend
Shows the Azure service with the highest spend during the billing period, along with the dollar amount and its percentage of total spend.
Estimated Savings Opportunity
Displays the total estimated savings opportunity across all recommendations, shown as both an annual and monthly figure. Click the link below the savings amount to open the full savings breakdown.
Savings come from two sources:
- Advisor — recommendations from Azure Advisor (Reserved Instances, Savings Plans, right-sizing, unattached resources, etc.)
- Estimate — recommendations from the ASecureCloud assessment engine based on best-practice checks
When multiple commitment terms are available for the same resource (e.g., a 1-Year and 3-Year Reserved Instance), the aggregate uses the highest-saving term per resource to avoid double-counting.
Spend Charts
Spend Over Time
An area chart showing daily spend over the billing period. Use the dropdown filter to isolate spend for a specific Azure service, or select All Services to see the aggregate.
Spend by Service
A horizontal bar chart ranking all Azure services by total spend during the billing period, from highest to lowest. Click View Table to jump to the detailed service table below.
Spend by Subscription
A horizontal bar chart showing spend broken down by Azure subscription. Useful for identifying which subscriptions are driving the most cost in multi-subscription environments. Click View Table to jump to the detailed subscription table below.
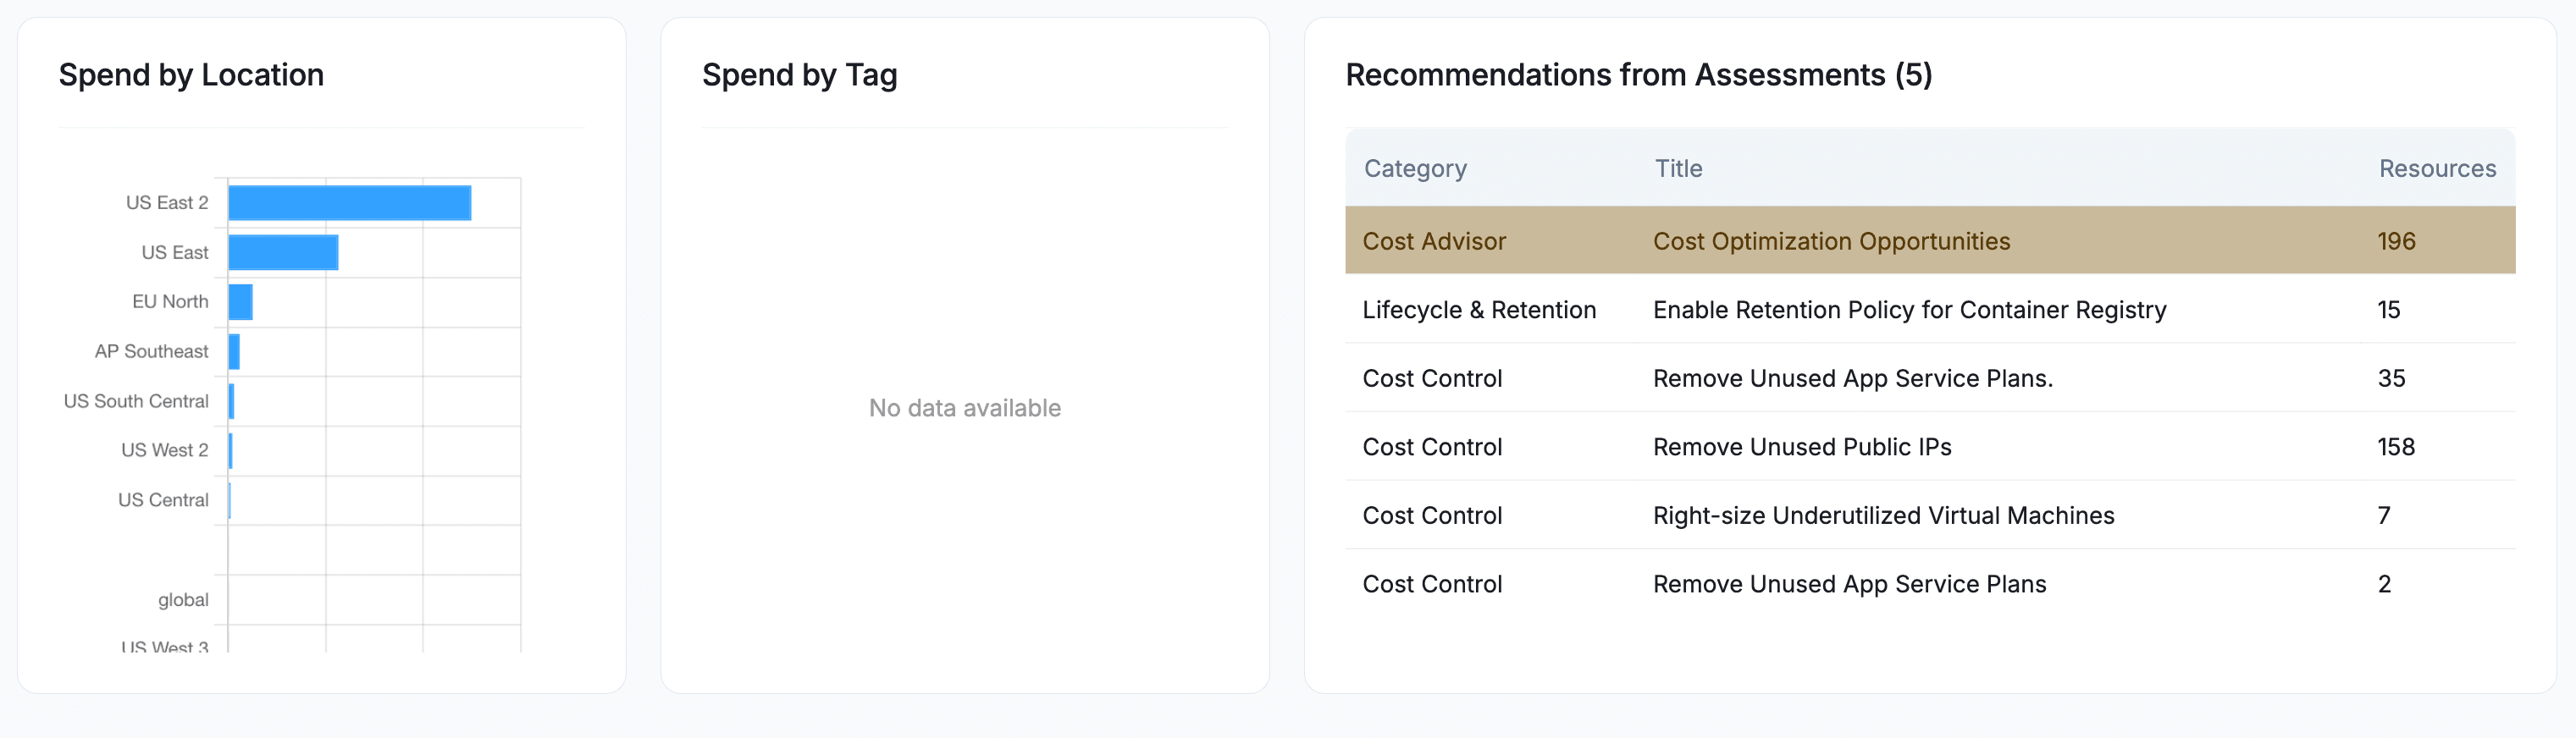
Spend by Location
A horizontal bar chart showing spend broken down by Azure region. Helps identify whether workloads are concentrated in expected regions or if there is unexpected spend in other locations.
Spend by Tag
A horizontal bar chart showing spend grouped by Azure resource tags. This is useful for understanding cost allocation across teams, projects, or environments. If resources are not tagged, this chart will show “No data available.”
Recommendations from Assessments
A table listing cost optimization recommendations generated by the ASecureCloud assessment engine and Azure Advisor. Each row shows the recommendation category, title, and the number of affected resources.
Click any row to view the full details and affected resources.
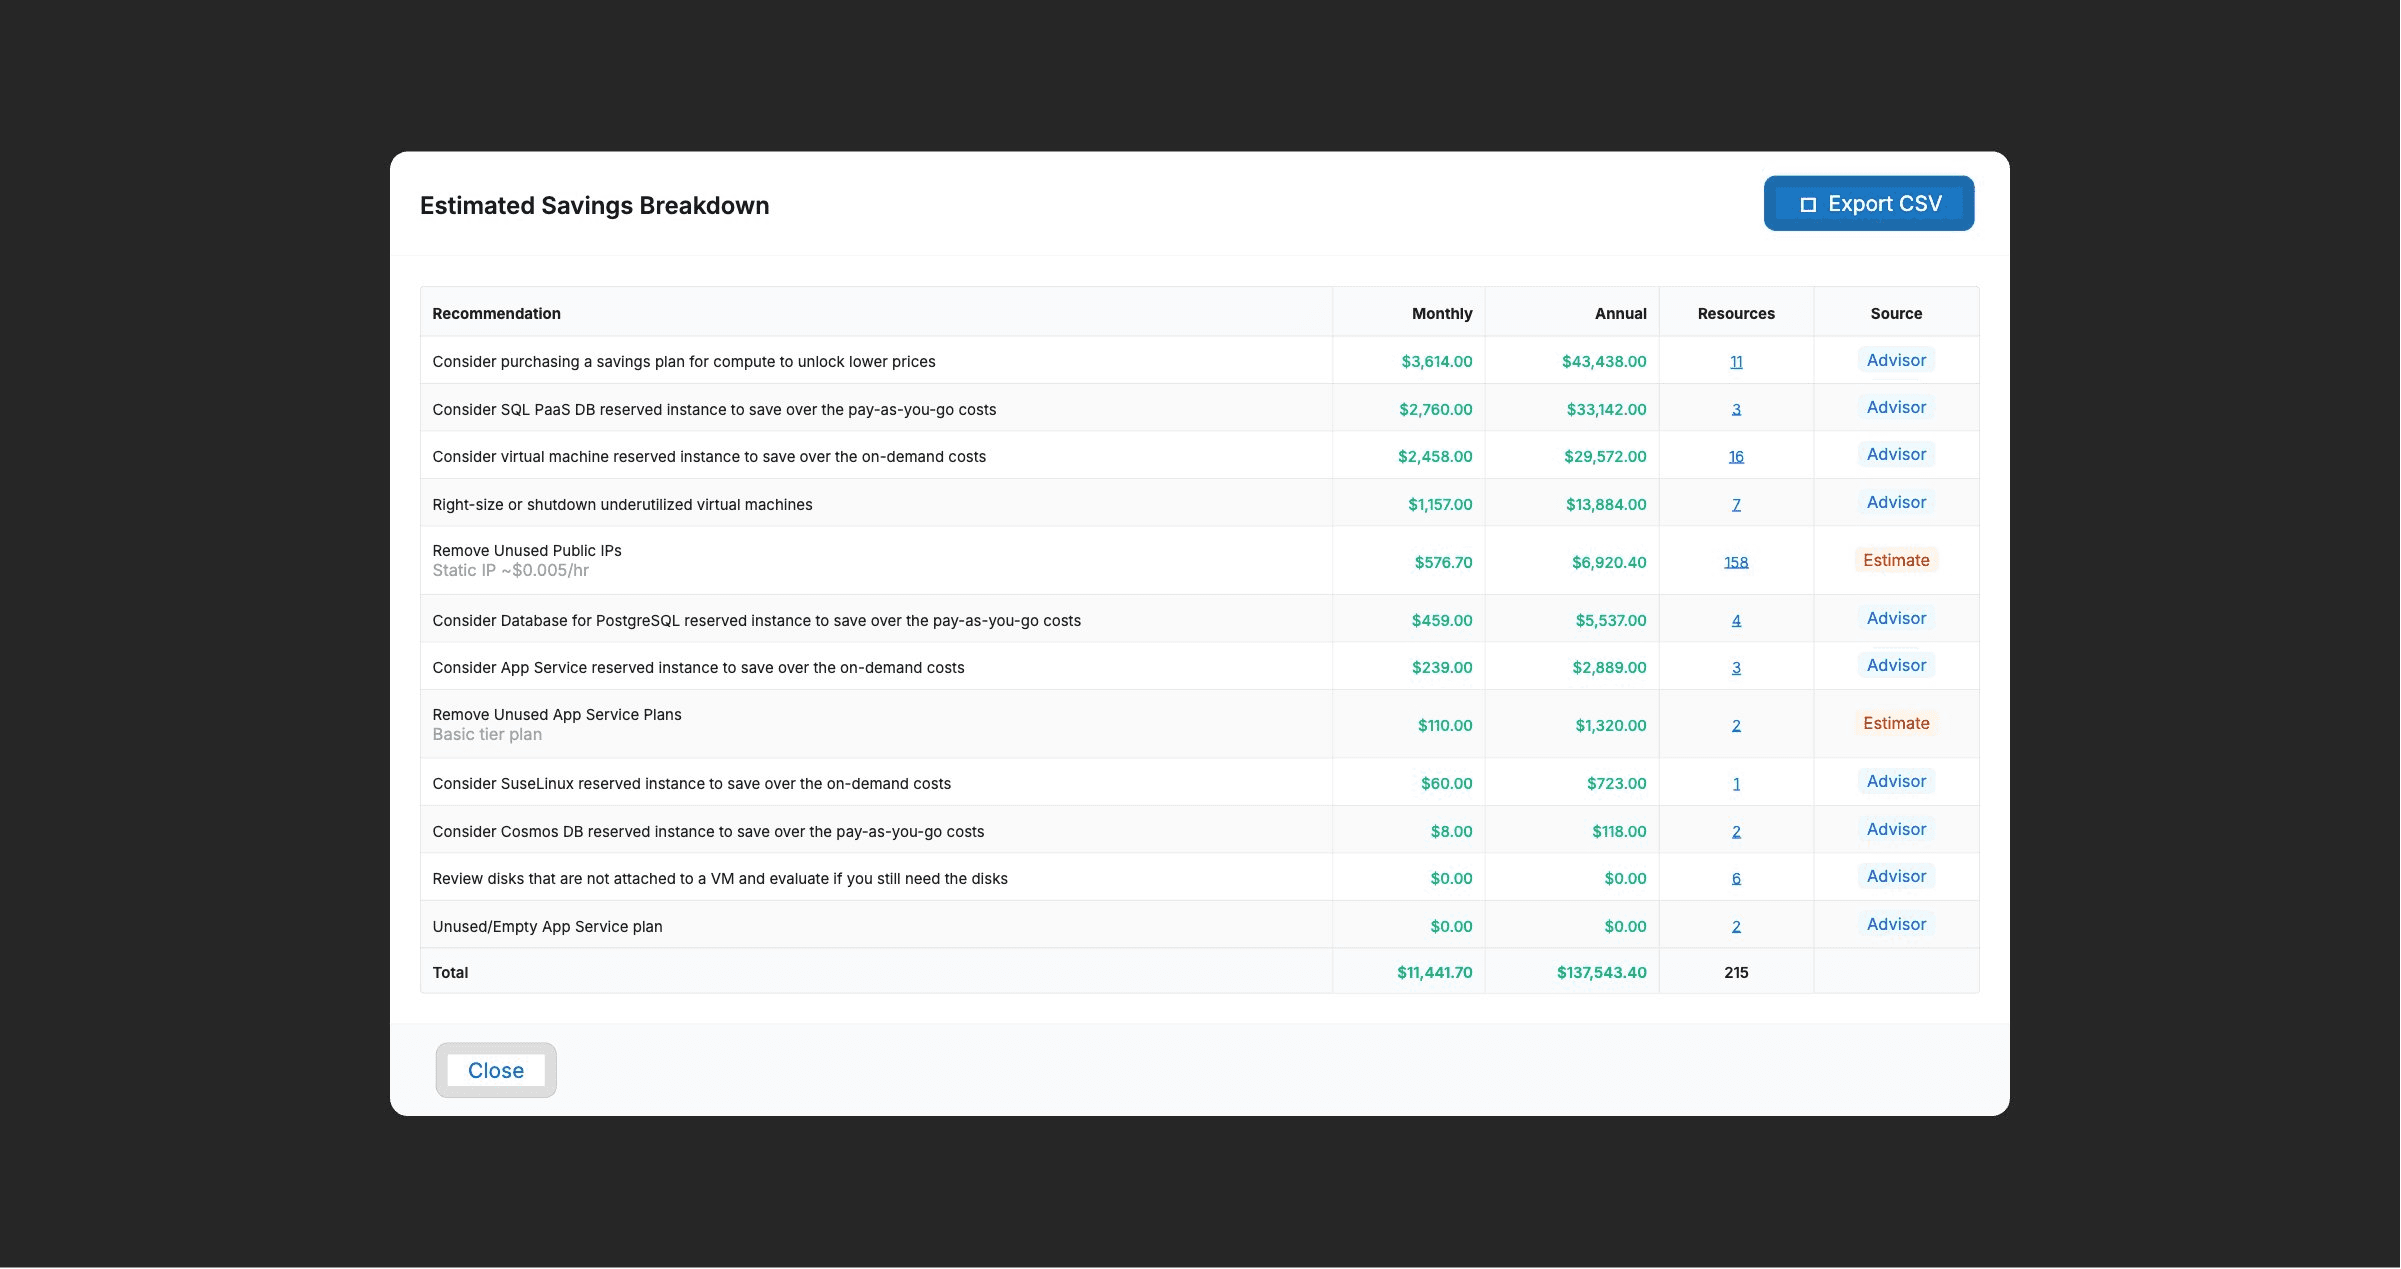
Estimated Savings Breakdown
Clicking the savings link on the Estimated Savings Opportunity card opens a detailed breakdown of all cost recommendations. Each row shows:
| Column | Description |
|---|---|
| Recommendation | The specific optimization action recommended |
| Monthly | Estimated monthly savings if the recommendation is implemented |
| Annual | Estimated annual savings |
| Resources | Number of affected resources (click to view the resource list) |
| Source | Where the recommendation comes from — Advisor (Azure Advisor) or Estimate (ASecureCloud assessment engine) |
This breakdown can be exported to CSV using the Export CSV button.
Resource Detail View
Clicking the resource count in the savings breakdown opens a detail view listing the individual resources affected by that recommendation. The columns shown depend on the recommendation type.
Reserved Instance Recommendations
For Reserved Instance (RI) recommendations, the table shows:
| Column | Description |
|---|---|
| Subscription | The Azure subscription where the recommended purchase applies |
| SKU | The specific VM size or resource SKU (e.g., Standard_DS5_v2) |
| Qty | The recommended number of reserved instances to purchase |
| Region | The Azure region where the resources are running |
| 1-Year Savings | Estimated monthly savings with a 1-year commitment, if available |
| 3-Year Savings | Estimated monthly savings with a 3-year commitment, if available |
A dash (–) in a savings column means that commitment term is not available for that particular SKU.
The savings amount shown for each row is the total savings for the full quantity — not a per-unit value. For example, if Qty is 3 and 1-Year Savings is $1,246.00/mo, that is the total monthly savings from purchasing all 3 reserved instances.
Right-Sizing and Shutdown Recommendations
For VM right-sizing or shutdown recommendations, the table shows:
| Column | Description |
|---|---|
| Resource Name | The name of the virtual machine |
| Region | The Azure region where the VM is running |
| Savings | Estimated monthly savings from right-sizing or shutting down the VM |
Unattached Disk Recommendations
For unattached disk recommendations, the table shows:
| Column | Description |
|---|---|
| Resource Name | The name of the unattached managed disk |
| Region | The Azure region where the disk exists |
| Savings | Estimated monthly savings from deleting or deallocating the disk |
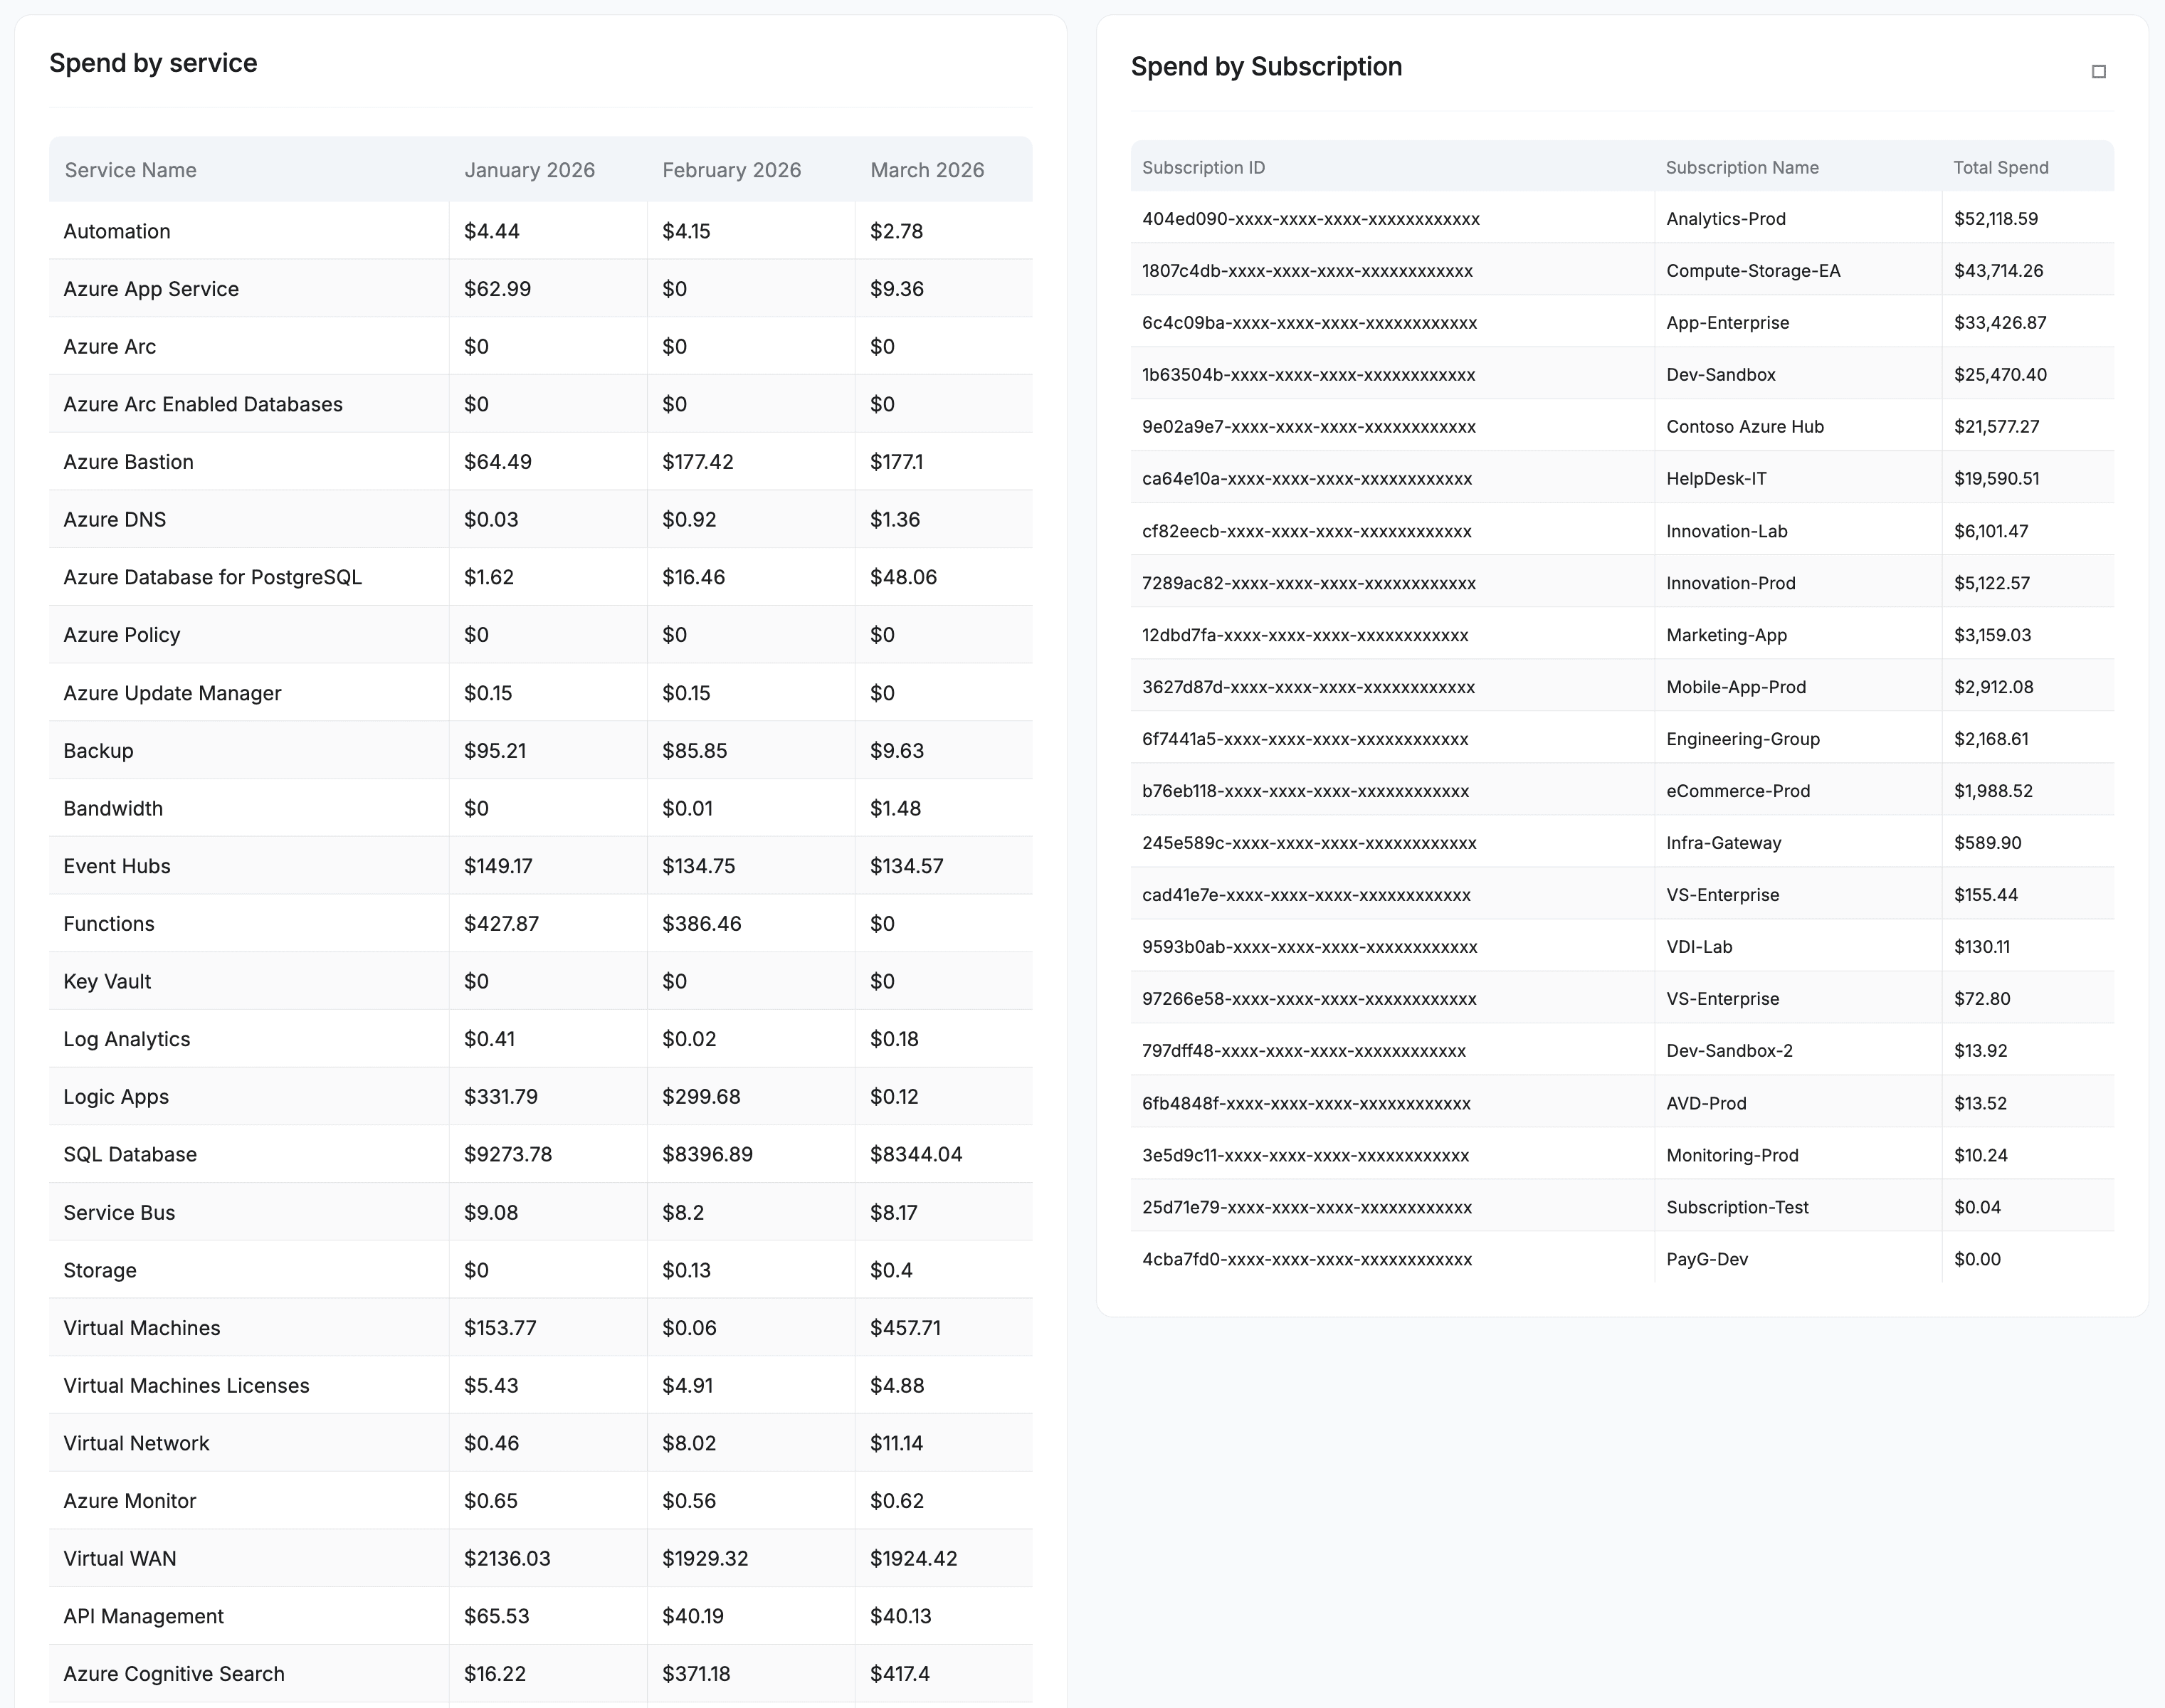
Data Tables
Spend by Service Table
A detailed table showing monthly spend broken down by Azure service. Each row represents a service, with columns for each month in the billing period.
Spend by Subscription Table
A detailed table showing spend broken down by Azure subscription, including the Subscription ID, Subscription Name, and Total Spend. This table can be exported to CSV using the Export to CSV button.
Data Sources
| Source | Description |
|---|---|
| Azure Cost Management | Billing and usage data collected from the Azure Cost Management API. Provides daily and monthly spend breakdowns by service, subscription, region, and tag. |
| Azure Advisor | Cost optimization recommendations from Azure Advisor, including Reserved Instance and Savings Plan purchase suggestions, right-sizing, and resource cleanup. |
| Assessment Engine | ASecureCloud assessment checks that identify cost-saving opportunities based on Azure best practices (e.g., unattached public IPs, idle load balancers, unused App Service plans). |
Glossary
| Term | Definition |
|---|---|
| Reserved Instance (RI) | A commitment to use a specific Azure resource type (e.g., a VM SKU) for a 1-year or 3-year term in exchange for a discounted rate compared to on-demand pricing. |
| Savings Plan | A flexible commitment to spend a fixed hourly amount on eligible Azure compute services for 1 or 3 years, applied automatically across subscriptions. |
| Right-Sizing | Changing a virtual machine to a smaller or more appropriate SKU based on actual usage patterns to reduce costs. |
| SKU | Stock Keeping Unit — the specific size and configuration of an Azure resource (e.g., Standard_DS5_v2 for a VM). |
| On-Demand | The standard pay-as-you-go pricing for Azure resources, without any commitment discount. |